System Health Monitor
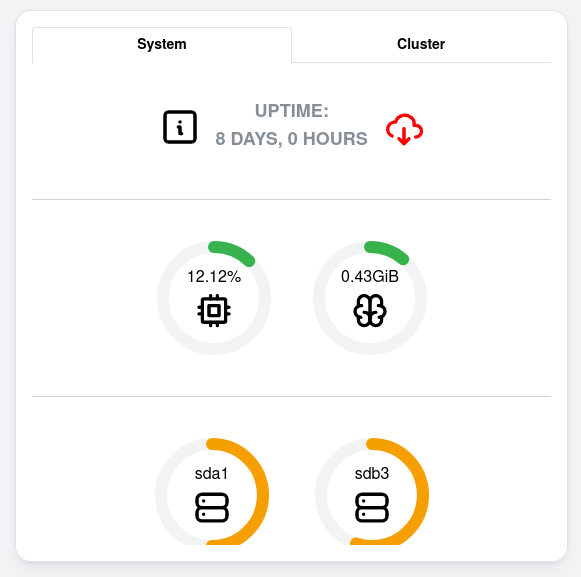
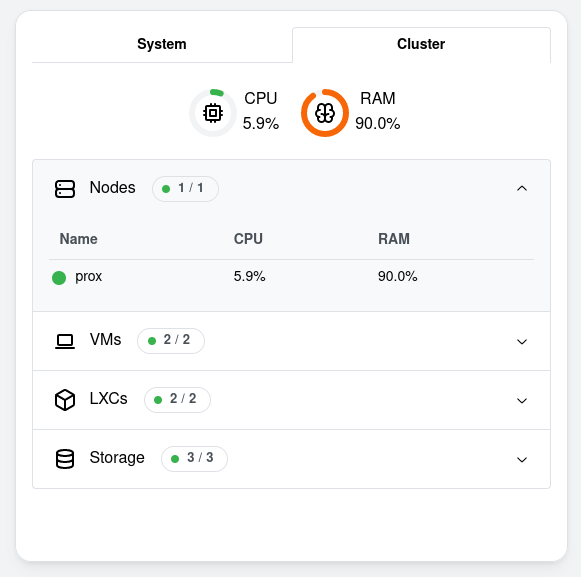
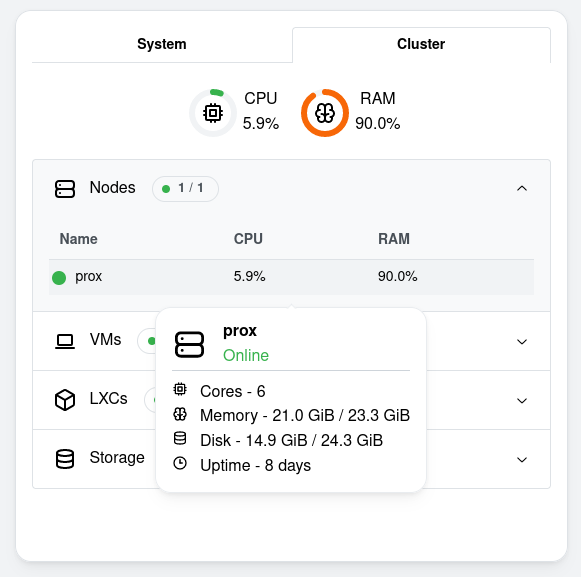
The system health monitor widget enables you to integrate with OpenMediaVault and Proxmox. Using the widget, you can view performance and resource data for your systems.
Adding the widget
Please check out our documentation on how to add a widget.
Configuration
| Configuration | Description | Values | Default Value |
|---|---|---|---|
| CPU Temp in Fahrenheit | Display the CPU temperature in Fahrenheit or Celsius | yes / no | no |
| Show CPU Info | Diplays CPU info in the system tab | yes / no | yes |
| Show Memory Info | Diplays memory info in the system tab | yes / no | yes |
| Show Filesystem Info | Diplays filesystem info in the system tab | yes / no | yes |
| Tabs open by default | Selects tab open by default. Only used when multiple integrations are available. |
| System |
| Filter by node name | Filters the displayed cluster data to show only a specific node | node name | none |
| Section open by default | Opens a specific section on the Cluster display by default |
| None |
| Show summary section | Shows summary section on the Cluster display | yes / no | yes |
| Show nodes section | Shows nodes section on the Cluster display | yes / no | yes |
| Show VMs section | Shows VMs section on the Cluster display | yes / no | yes |
| Show LXCs section | Shows LXCs section on the Cluster display | yes / no | yes |
| Show storage section | Shows storage section on the Cluster display | yes / no | yes |
| Requirement for section status indicator to be 'OK' | 'All' requires that all items be online for the indicator to be green. 'Any' requires at least one item to be online. |
| System |
| Ignore Certificate Errors | Ignore HTTPS certificate errors when acecssing the cluster API | yes / no | yes |
Screenshots


